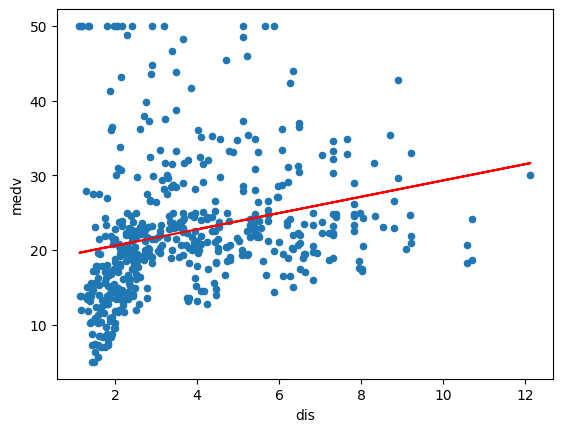
In this article I’m going to documate my progress through my first econometrics project; analysing the effect of distance from employment centres on house prices. By doing this I would like to analyse the effect of accessible employment and what impact this could have on policy making. I have used data from the boston housing dataset (data from the City of boston in 1996). Specifically we will be looking at the median house value (medv) and weighted distance from 5 boston housing centres (dis). I will be using python, specifically the statsmodels library for my regression. I hypothesise that median house value is likely to increase with distance from employment centres based on observations within my own town.
Setting up python:
Analysing the data

Visualising our data we can see that utilising a linear model may lead to functional misspecification. The regression line reveals this poor fit suggesting potential functional misspecification. This is further evidenced by the presence of heteroskedasticity in the residuals. We can see that it appears to have a logarithmic relationship; as distance from employment centres increases, the resulting increase in median house value decreases. To correct this I have experimented by using Log-lin, lin-log and log-log models.
Based on the R-squared value, the log-log model appears to explain a greater proportion of the variation in the dependent variable compared to other models considered. Additionally, inspecting the scatter plot suggests that the log-log model’s regression line more closely follows the data pointsTo further compare the model I initially thought of using MSE but soon realised as it was not scale invariant and so I was unable to use this as a source of comparison. RMSPE was the next option but this was unfortunately not built into statsmodels.
Evaluation
Evaluating the models, the log-log model deems itself to be the best fit for our data, so I will move forward with this model in testing the gauss markov assumptions and my final evaluation.
Gauss markov assumptions:
The model, y = mx + c satisfies the 1st assumption of the Gauss-Markov theorem due to its inherent linear nature. Random sampling of the data ensures the second Gauss-Markov assumption is upheld. Furthermore, the absence of collinearity is guaranteed given the model has a single independent variable.
Zero conditional mean of errors
As this assumption can not be directly tested I will be analysing whether there is the possibility of reverse causality or omitted variable bias in my model as they can cause the violation of the 3rd gauss markov assumption.
Firstly discussing reverse causality you could raise the argument that firms may look toward areas with lower land value to lower costs and firms targeting richer customers may look to set up near wealthier customers and vice-versa. I would say this is more relevant to individual firms and employment centres in smaller locations, for cities however this would be less applicable as firms target a range of workers and customers. Moreover firms located in large cities depend more on factors such as location, transportation infrastructure, availability of skilled workers and the needs of the business than housing value in the area.
The likelihood of omitted variables is very high in this case as house prices are influenced by a variety of factors such as crime rate, distance to schools, facilities in the area, location etc. This means that our coefficient is likely an overestimate. To improve our estimator we should look to add more relevant parameters, as this is a very basic estimator and in an introductory project that was highly likely. As a result this estimator does not follow the 3rd gauss markov assumption, and so it will not be BLUE.
Homoscedasticity
Giving a quick visual inspection there doesn’t seem to be any specific shapes for the spread of the points such as a funnel, however there does not seem to be constant variance around the line of best fit. To quantitatively analyse this the breusch pagan test is used, applying this test specifically the LM version i obtained a p-value of 2.8895e-11, comparing this to a significance level of 0.05 we have a significant result, suggesting that there is enough evidence to accept the alternative hypothesis and there is heteroskedasticity.
As discussed above we have already established that there are omitted variables in our model, this is the likely cause of our heteroskedasticity, although it may also be the cause of functional misspecification. Moving forward adding an omitted variable and adjusting the parameters used we can attempt to remove heteroskedasticity. If it is still present, using alternatives to OLS such as GLS could address the issue.
Conclusion
Given that our estimator is not BLUE, making inferences about the population based on our coefficient estimates is not advisable. Moving forward with this project I aim to implement the solutions detailed above and produce a better estimator. Commenting on my hypothesis, judging by the scatter it seems that although median house price does increase with distance the rate of this increase diminishes. To conclude, although I was unsuccessful in achieving a strong prediction for the relationship between distance from employment centres and median house value, this project has given me an understanding and practical experience with econometrics.
Leave a Reply